Once we have learned how to read and save files in the previous chapter, it is time to add a new feature to our sample application: create a chart that allows us to visually see the expenses made in each of the categories.
For this we will use a very powerful class among those available in the Xojo library: Canvas.
As the name indicates, the Canvas is a very special type of control since it provides us with a "canvas" on which we can freely draw what each of our applications requires, not only through the properties available in the class itself but also using all the functions provided. from another of the classes that is closely related to this: Graphics.
Specifically, the drawing on the Canvas is carried out through the code written in its Paint event handler, which can be automatically invoked by the operating system every time it is necessary to update the content of the canvas (remember that Xojo is native cross-platform), or we are we force the redraw by invoking the methods Refresh (immediate) or Invalidate (delegating the refresh of the control when it is more appropriate for the operating system).
Throughout the tutorial we will also create an auxiliary class that will allow us to draw statistical graphs (accumulated expenses by category) with greater flexibility.
Furthermore, creating this auxiliary class also allows us to abstract the type of values to represent. That is, in this case we know that it is a matter of representing values corresponding to personal expenses using the bar chart, but providing this level of abstraction means that you can continue to use the new classes discussed in this chapter also to represent any other type of numerical value. in other applications you can create.
On the other hand, and to see to some extent the flexibility provided by the Graphics class, we will create our statistical graphs object so that it is really easy to control how we want to present the bars: using solid colors or color gradients, also decide the colors that we want to assign to each bar, and also whether we want to apply a shadow effect to each of them or not; as well as the width with which we want to draw each of the bars.
The drawing code will also have the task of proportionally calculating the drawing height for each of the bars, not only on the value presented by the rest, but also on the maximum height available in the window or panel that will include the graphic control.
This means that, by changing the size of the window, you will see how the graphic control recalculates and redraws each of the bars in real time, always maintaining the proportion corresponding to the value represented by each of them.
And if in this example we are using the Canvas control to draw graphics, it is very interesting that you know that this is also the control you need to use when you have to create, from scratch, a completely custom UI control.
In fact, the available event handlers will allow you to control all the aspects usually associated with user interaction: when the cursor enters or exits the surface, when it is clicked, when objects are dragged or dropped on its surface, as well as responding to keyboard events.
In short, through Canvas you can create any control widget or UI you can imagine and want to add to your application.
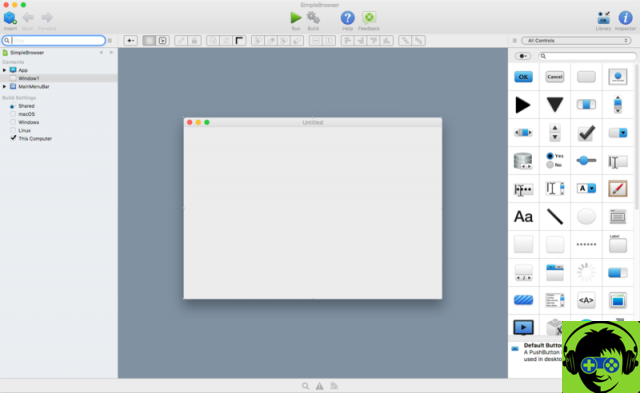
I invite you not only to reproduce the tutorial in the Xojo IDE (of course you can also download the Xojo project used in the example, but to try your first steps with the Graphics class in conjunction with Canvas.
If you have any questions or problems, comments are open,